My boyfriend recently introduced me to Advent of Code while I was in one of my “learn ALL of the things!” phases. Every year starting December 1st, new programming challenges are posted daily leading up to Christmas. They’re meant to be quick 5-10 minute challenges, so, wanting to test my programming skills, I figured why not try to do all of them in base R!
I went with base R because I know I can dplyr and stringr my way to victory with some of these challenges. I really want to force myself to really go back to basics and confirm that I have the knowledge to do these things on my own without Hadley Wickham‘s (very much appreciated in any other situation) assistance.
Since I’ve started, I’ve also seen a couple of other bloggers attempt to do these challenges in R so I’m really curious how my solutions will compare to theirs.
The first day of the challenge provides you with a string of numbers and asks you to sum all of the digits that match the next digit in a circular list, i.e. the digit after the last digit is the first digit.
My string was…
8231753674683997878179259195565332579493378483264978184143341284379682788518559178822225126625428318115396632681141871952894291898364781898929292614792884883249356728741993224889167928232261325123447569829932951268292953928766755779761837993812528527484487298117739869189415599461746944992651752768158611996715467871381527675219481185217357632445748912726487669881876129192932995282777848496561259839781188719233951619188388532698519298142112853776942545211859134185231768952888462471642851588368445761489225786919778983848113833773768236969923939838755997989537648222217996381757542964844337285428654375499359997792679256881378967852376848812795761118139288152799921176874256377615952758268844139579622754965461884862647423491918913628848748756595463191585555385849335742224855473769411212376446591654846168189278959857681336724221434846946124915271196433144335482787432683848594487648477532498952572515118864475621828118274911298396748213136426357769991314661642612786847135485969889237193822718111269561741563479116832364485724716242176288642371849569664594194674763319687735723517614962575592111286177553435651952853878775431234327919595595658641534765455489561934548474291254387229751472883423413196845162752716925199866591883313638846474321161569892518574346226751366315311145777448781862222126923449311838564685882695889397531413937666673233451216968414288135984394249684886554812761191289485457945866524228415191549168557957633386991931186773843869999284468773866221976873998168818944399661463963658784821796272987155278195355579386768156718813624559264574836134419725187881514665834441359644955768658663278765363789664721736533517774292478192143934318399418188298753351815388561359528533778996296279366394386455544446922653976725113889842749182361253582433319351193862788433113852782596161148992233558144692913791714859516653421917841295749163469751479835492713392861519993791967927773114713888458982796514977717987598165486967786989991998142488631168697963816156374216224386193941566358543266646516247854435356941566492841213424915682394928959116411457967897614457497279472661229548612777155998358618945222326558176486944695689777438164612198225816646583996426313832539918
My first thought was that I would need to separate this string such that each character was the element of an object, either a vector or a list. I kept things simple and started by just copy-pasting the string into R. I could import it as a .txt file or otherwise but I figured that was unnecessary for such a quick problem. I stored the string as a variable named input.
# Split string after each character.

input_split <- strsplit(input, "")

# As a result, input_split is a list with 1 element:
# a vector containing each character of input as an
# element. Annoying. Let's unlist() it to extract
# *just* the vector.

char_vector <- unlist(input_split)

# The problem now is that if we are going to sum
# the elements of our string, we need them to be
# numeric and not characters. Easy enough...

num_vector <- as.numeric(char_vector)

# Now lets just initialize our sum...

num_sum = 0

# And use a loop...

for(i in 1:length(num_vector)){

  # If we have the last element of the input string,
  # set the next number equal to the first element
  # of the string, else select element i + 1.
  next_num <- ifelse(i = length(num_vector),
  				num_vector[1],
  				num_vector[i + 1])


  # If our current element is equal to the next element,
  # update the sum.
  if(num_vector[i] == next_num){

  	num_sum = num_sum + num_vector[i]

  }
}

num_sum
Our sum is 1390 which is correct, huzzah.
Continue reading Advent of Code 2017 in R: Day 1
 ,
,  , the relationship between
  and
and  can be defined generally as
![\[ y_i = m(x_i) + \varepsilon_i \]](https://statisticelle.com/wp-content/ql-cache/quicklatex.com-78fa8d7d51d22115d6a1fe5a2c1bdf3b_l3.png "Rendered by QuickLaTeX.com")
![f(x_i) = E[y_i | x = x_i]](https://statisticelle.com/wp-content/ql-cache/quicklatex.com-cce0672391a02b3395ffd209d0d01d74_l3.png "Rendered by QuickLaTeX.com") and
and  . If we are unsure about the form of
  , our objective may be to estimate
  . Here,
  and
and  . The true function
  is displayed in green.
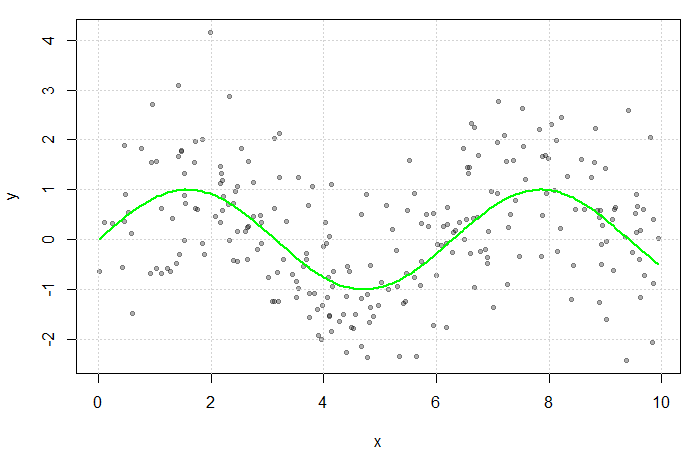
 could be estimated by averaging the value of the response at each
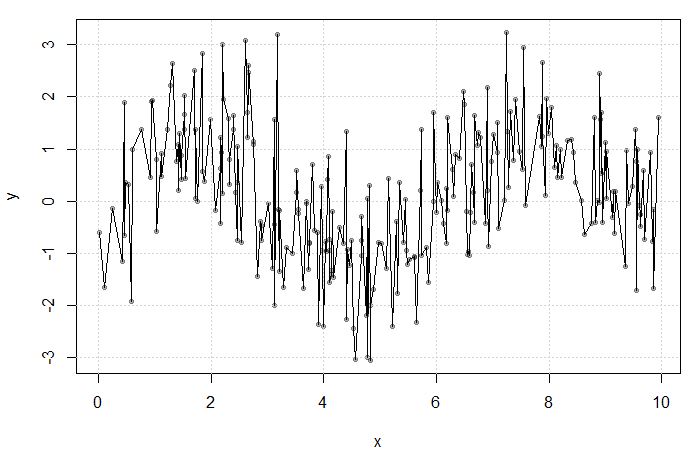
 at each
  . The fit is extremely rough due to gaps in
  for some bandwidth
  . Then, a simple non-parametric estimate of
  can be constructed as average of the
![\[ K(u) = \begin{cases} \frac{1}{2} & |u| \leq 1 \\ 0 & \text{o.w.} \end{cases} \]](https://statisticelle.com/wp-content/ql-cache/quicklatex.com-27c264e157b25fba34a6f4f7702c9ce2_l3.png "Rendered by QuickLaTeX.com")
 (see my previous blog bost). It is, however, convention to use kernel functions of degree
  (e.g. the Gaussian and Epanechnikov kernels).
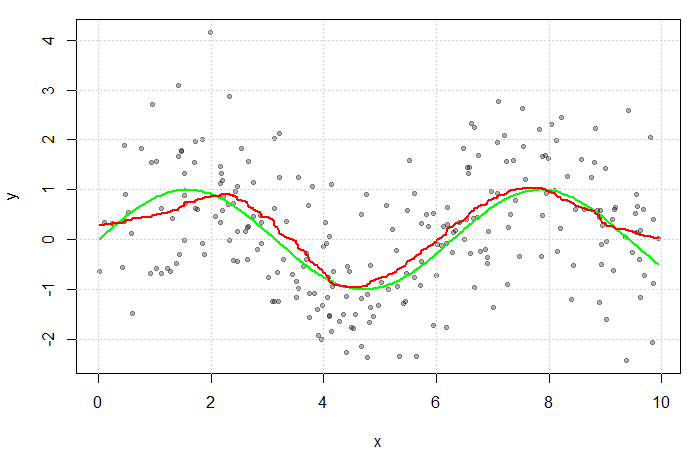
 . The green line represents the true function
  .
. be a random variable with a continuous distribution function (CDF)
  and probability density function (PDF)
![\[f(x) = \frac{d}{dx} F(x)\]](https://statisticelle.com/wp-content/ql-cache/quicklatex.com-b7f63dc97bf17d7fd7215a8e571dc414_l3.png "Rendered by QuickLaTeX.com")
 . Estimation of
 ![\[ \hat{Pr}(C = c | X = x_0) = \frac{\hat{\pi}_c \hat{f}_{c}(x_0)}{\sum_{k=1}^{C} \hat{\pi}_{k} \hat{f}_{k}(x_0)} \]](https://statisticelle.com/wp-content/ql-cache/quicklatex.com-ec4bde07d3f9cbbb654aca700939e681_l3.png "Rendered by QuickLaTeX.com")