Parametric vs. Nonparametric Approach to Estimations

Parametric statistics assume that the unknown CDF F belongs to a family of CDFs characterized by a parameter (vector) \theta. As the form of F is assumed, the target of estimation is its parameters \theta. Thus, all uncertainty about F is comprised of uncertainty about its parameters. Parameters are estimated by \hat{\theta}, and estimates are be substituted into the assumed distribution to conduct inference for the quantities of interest. If the assumed distribution F is incorrect, inference may also be inaccurate, or trends in the data may be missed.

To demonstrate the parametric approach, consider n = 100 independent and identically distributed random variables X_1, …, X_n generated from an exponential distribution with rate \lambda = 2. Investigators wish to estimate the 75^{th} percentile and erroneously assume that their data is normally distributed. Thus, F is assumed to be the Normal CDF but \mu and \sigma^2 are unknown. The parameters \mu and \sigma are estimated in their typical way by \bar{x} and \sigma^2, respectively. Since the normal distribution belongs to the location-scale family, an estimate of the p^{th} percentile is provided by,

    \[x_p = \bar{x} + s\Phi^{-1}(p)\]

where \Phi^{-1} is the standard normal quantile function, also known as the probit.

set.seed(12345)
library(tidyverse, quietly = T)
# Generate data from Exp(2)
x <- rexp(n = 100, rate = 2)

# True value of 75th percentile with rate = 2
true <- qexp(p = 0.75, rate = 2) 
true
## [1] 0.6931472
# Estimate mu and sigma
xbar <- mean(x)
s    <- sd(x)

# Estimate 75th percentile assuming mu = xbar and sigma = s
param_est <- xbar + s * qnorm(p = 0.75)
param_est
## [1] 0.8792925

The true value of the 75^{th} percentile of \text{Exp}(2) is 0.69 while the parametric estimate is 0.88.

Nonparametric statistics make fewer distributions about the unknown distribution F, requiring only mild assumptions such as continuity or the existence of specific moments. Instead of estimating parameters of F, F itself is the target of estimation. F is commonly estimated by the empirical cumulative distribution function (ECDF) \hat{F},

    \[\hat{F}(x) = \frac{1}{n} \sum_{i=1}^{n} \mathbb{I}(X_i \leq x).\]

Any statistic that can be expressed as a function of the CDF, known as a statistical functional and denoted \theta = T(F), can be estimated by substituting \hat{F} for F. That is, plug-in estimators can be obtained as \hat{\theta} = T(\hat{F}).

Continue reading Parametric vs. Nonparametric Approach to Estimations

The Probabilistic Index for Two Normally Distributed Outcomes

Consider a two-armed study comparing a placebo and treatment. In general, the probabilistic index (PI) is defined as,

    \[\text{PI} = P(X < Y) + \frac{1}{2} P(X = Y)\]

and is interpreted as the probability that a subject in the treatment group will have an increased response compared to a subject in the placebo group. The probabilistic index is a particularly useful effect measure for ordinal data, where effects can be difficult to define and interpret owing to absence of a meaningful difference. However, it can also be used for continuous data, noting that when the outcome is continuous, P(X = Y) = 0 and the PI reduces to P(X < Y).

PI = 0.5 suggests an increased outcome is equally likely for subjects in the placebo and treatment group, while PI > 0.5 suggests an increased outcome is more likely for subjects in the treatment group compared to the placebo group, and the opposite is true when PI < 0.5.

Simulation

Suppose X \sim N(\mu_X, \sigma^{2}_{X}) and Y \sim N(\mu_Y, \sigma^{2}_{Y}) represent the independent outcomes in the placebo and treatment groups, respectively and an increased value of the outcome is the desired response.

We simulate n_X = n_Y = 50 observations from each group such that treatment truly increases the outcome and the variances within each group are equal such that \sigma^{2}_{X} = \sigma^{2}_{Y}.

# Loading required libraries
library(tidyverse)
library(gridExtra)

# Setting seed for reproducibility
set.seed(12345)
# Simulating data
n_X = n_Y = 50
sigma_X = sigma_Y = 1
mu_X = 5; mu_Y = 7

outcome_X = rnorm(n = n_X, mean = mu_X, sd = sigma_X)
outcome_Y = rnorm(n = n_Y, mean = mu_Y, sd = sigma_Y)

df <- data.frame(Group = c(rep('Placebo', n_X), rep('Treatment', n_Y)),
                 Outcome = c(outcome_X, outcome_Y))

Examining side-by-side histograms and boxplots of the outcomes within each group, there appears to be strong evidence that treatment increases the outcome as desired. Thus, we would expect a probabilistic index close to 1 as most outcomes in the treatment group appear larger than those of the placebo group.

# Histogram by group
hist_p <- df %>%
  ggplot(aes(x = Outcome, fill = Group)) +
    geom_histogram(position = 'identity', alpha = 0.75, bins = 10) + 
    theme_bw() +
    labs(y = 'Frequency')

# Boxplot by group
box_p <- df %>%
  ggplot(aes(x = Outcome, fill = Group)) +
    geom_boxplot() + 
    theme_bw() +
    labs(y = 'Frequency')

# Combine plots
grid.arrange(hist_p, box_p, nrow = 2)

plot of chunk unnamed-chunk-3

Continue reading The Probabilistic Index for Two Normally Distributed Outcomes

Kernel Regression

Motivation

For observed pairs (x_i, y_i), i = 1, …, n, the relationship between x and y can be defined generally as

    \[ y_i = m(x_i) + \varepsilon_i \]

where f(x_i) = E[y_i | x = x_i] and \varepsilon_i \stackrel{iid}{\sim} (0, \sigma^2). If we are unsure about the form of m(\cdot), our objective may be to estimate m(\cdot) without making too many assumptions about its shape. In other words, we aim to “let the data speak for itself”.

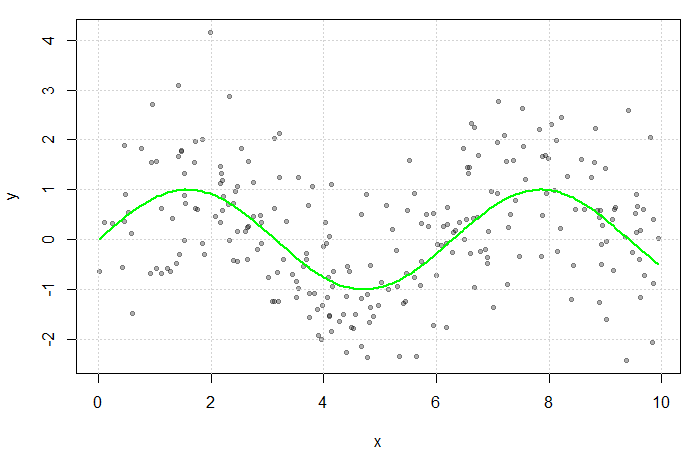
Simulated scatterplot of y = f(x) + \epsilon. Here, x \sim Uniform(0, 10) and \epsilon \sim N(0, 1). The true function f(x) = sin(x) is displayed in green.

Non-parametric approaches require only that m(\cdot) be smooth and continuous. These assumptions are far less restrictive than alternative parametric approaches, thereby increasing the number of potential fits and providing additional flexibility. This makes non-parametric models particularly appealing when prior knowledge about m(\cdot)‘s functional form is limited.

Estimating the Regression Function

If multiple values of y were observed at each x, f(x) could be estimated by averaging the value of the response at each x. However, since x is often continuous, it can take on a wide range of values making this quite rare. Instead, a neighbourhood of x is considered.

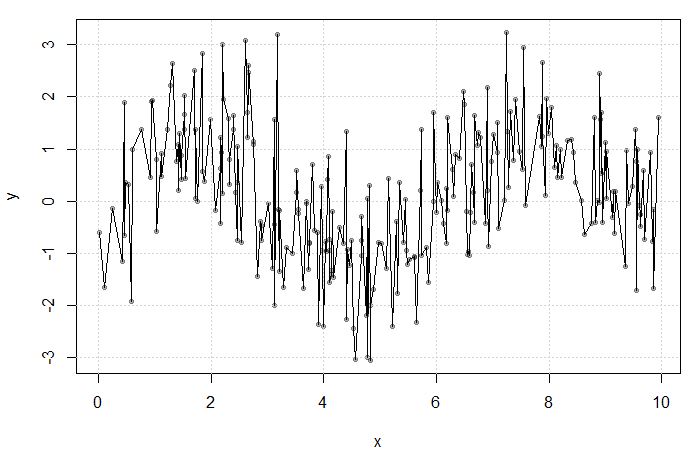
Result of averaging y_i at each x_i. The fit is extremely rough due to gaps in x and low y frequency at each x.

Define the neighbourhood around x as x \pm \lambda for some bandwidth \lambda > 0. Then, a simple non-parametric estimate of m(x) can be constructed as average of the y_i‘s corresponding to the x_i within this neighbourhood. That is,

(1)   \begin{equation*} \hat{f}_{\lambda}(x) = \frac{\sum_{n} \mathbb{I}(|x - x_i| \leq \lambda)~ y_i}{\sum_{n} \mathbb{I}(|x - x_i| \leq \lambda)} = \frac{\sum_n K\left( \frac{x - x_i}{\lambda} \right) y_i}{\sum_n K\left( \frac{x - x_i}{\lambda} \right) } \end{equation*}

where

    \[ K(u) = \begin{cases} \frac{1}{2} & |u| \leq 1 \\ 0 & \text{o.w.} \end{cases} \]

is the uniform kernel. This estimator, referred to as the Nadaraya-Watson estimator, can be generalized to any kernel function K(u) (see my previous blog bost). It is, however, convention to use kernel functions of degree \nu = 2 (e.g. the Gaussian and Epanechnikov kernels).

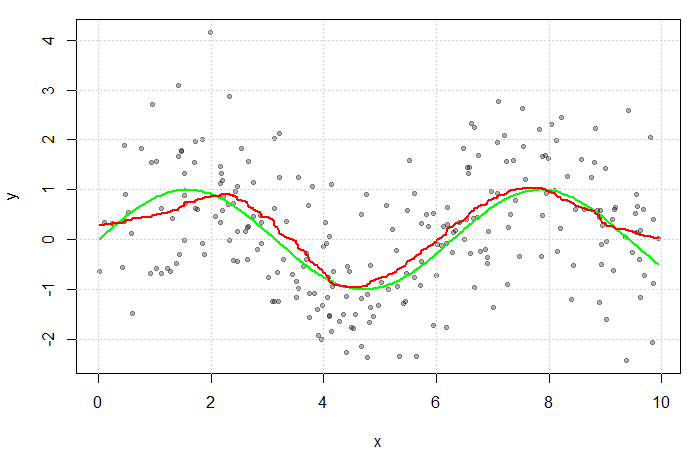
The red line is the result of estimating f(x) with a Gaussian kernel and arbitrarily selected bandwidth of \lambda = 1.25. The green line represents the true function sin(x).

Continue reading Kernel Regression

Kernel Density Estimation

Motivation

It is important to have an understanding of some of the more traditional approaches to function estimation and classification before delving into the trendier topics of neural networks and decision trees. Many of these methods build on an understanding of each other and thus to truly be a MACHINE LEARNING MASTER, we’ve got to pay our dues. We will therefore start with the slightly less sexy topic of kernel density estimation.

Let X be a random variable with a continuous distribution function (CDF) F(x) = Pr(X \leq x) and probability density function (PDF)

    \[f(x) = \frac{d}{dx} F(x)\]

Our goal is to estimate f(x) from a random sample \lbrace X_1, …, X_n \rbrace. Estimation of f(x) has a number of applications including construction of the popular Naive Bayes classifier,

    \[ \hat{Pr}(C = c | X = x_0) = \frac{\hat{\pi}_c \hat{f}_{c}(x_0)}{\sum_{k=1}^{C} \hat{\pi}_{k} \hat{f}_{k}(x_0)} \]

Continue reading Kernel Density Estimation